A container can display Up and at the same time display an inaccessible service. It can be reinitiated because the process ends, because a dependence fails or because the host remains without memory. And a volume can contain the right data even if we have recreated the wrong application. None of these symptoms are solved by default by reconstructing the image or re-initiating all services.
The proposal of this article is to use Docker as observable system: To collect evidence before changing status, to propose a verifiable hypothesis and to figure out what layer you are missing. The CLI offers precise data and Lazydocker helps navigate processes, containers, logs and resources. They do not compete with each other or replace applied metrics or distributed traces.
The documentary reference is Docker Engine 29.10.0 (release November 16, 2026) and Lazydicker v0.25.2. The commands are applied to a Linux machine with Docker Engine and Compose V2, unless otherwise stated. The scenarios and their expected results are lab proposals and have been put forward and have been tested. At Docker Desktop they change network and host details due to their virtual machine.
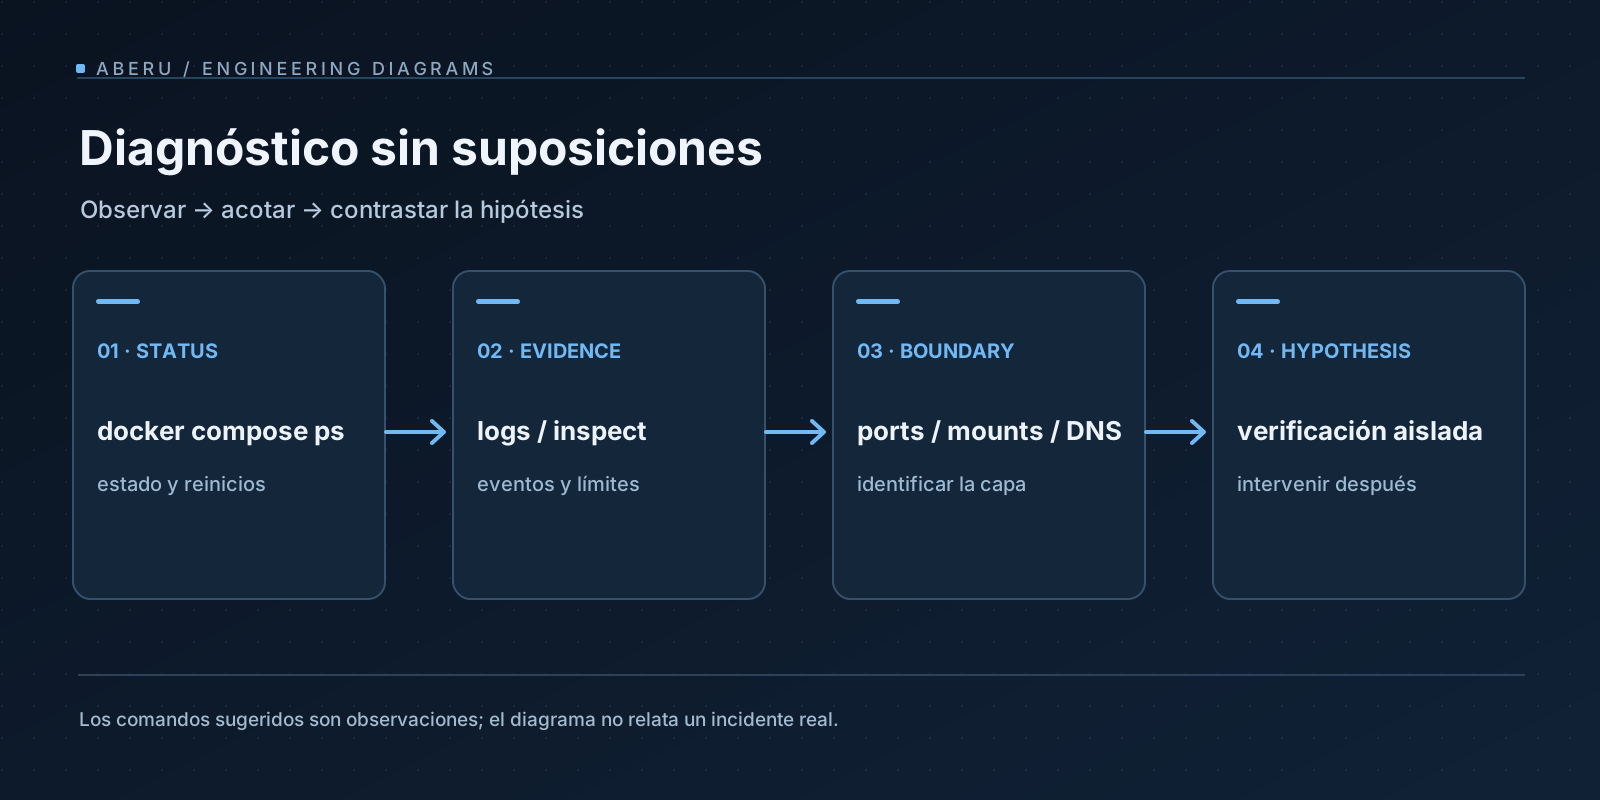
From symptom to cape: No single “Docker”
Before touching a container, the boundaries involved should be drawn mentally:
| Layer | Example of failure | Evidence we need |
|---|---|---|
| Implementation process | Closed with code other than zero and listening to an incorrect interface | Logs, Exit code, command and effective configuration |
| Runtime / container | Reforms, Failed Health Check, OOM | inspect status, events, memory boundaries |
| Internal network | A service doesn’t solve or reach B | Networks, DNS, service name and internal port |
| Publication / proxy | The service responds inside but not from the host | ports, listeners, firewall, proxy, TLS and public DNS |
| Persistence | Data apparently missing after recreation | Mount, actual volume, write and ownership routes |
| Host | A saturated disc, memory, CPU or I / O | Mics of the host, Docker events, statistics |
Docker uses namespaces to isolate resource views and cgroups for monitoring and accounting but a container isn’t a complete virtual machine. Your process uses the host kernel at Linux. Also, the file system of the container and the volumes have different life cycles: the espbible layer belongs to the container and the volume is an object of external persistence. See arquitectura de Docker, documentación de almacenamiento and volúmenes.
That separation changes the question of diagnosis: not “why does Docker fail?” but “what border has been broken and what evidence does it distinguish from alternatives?”
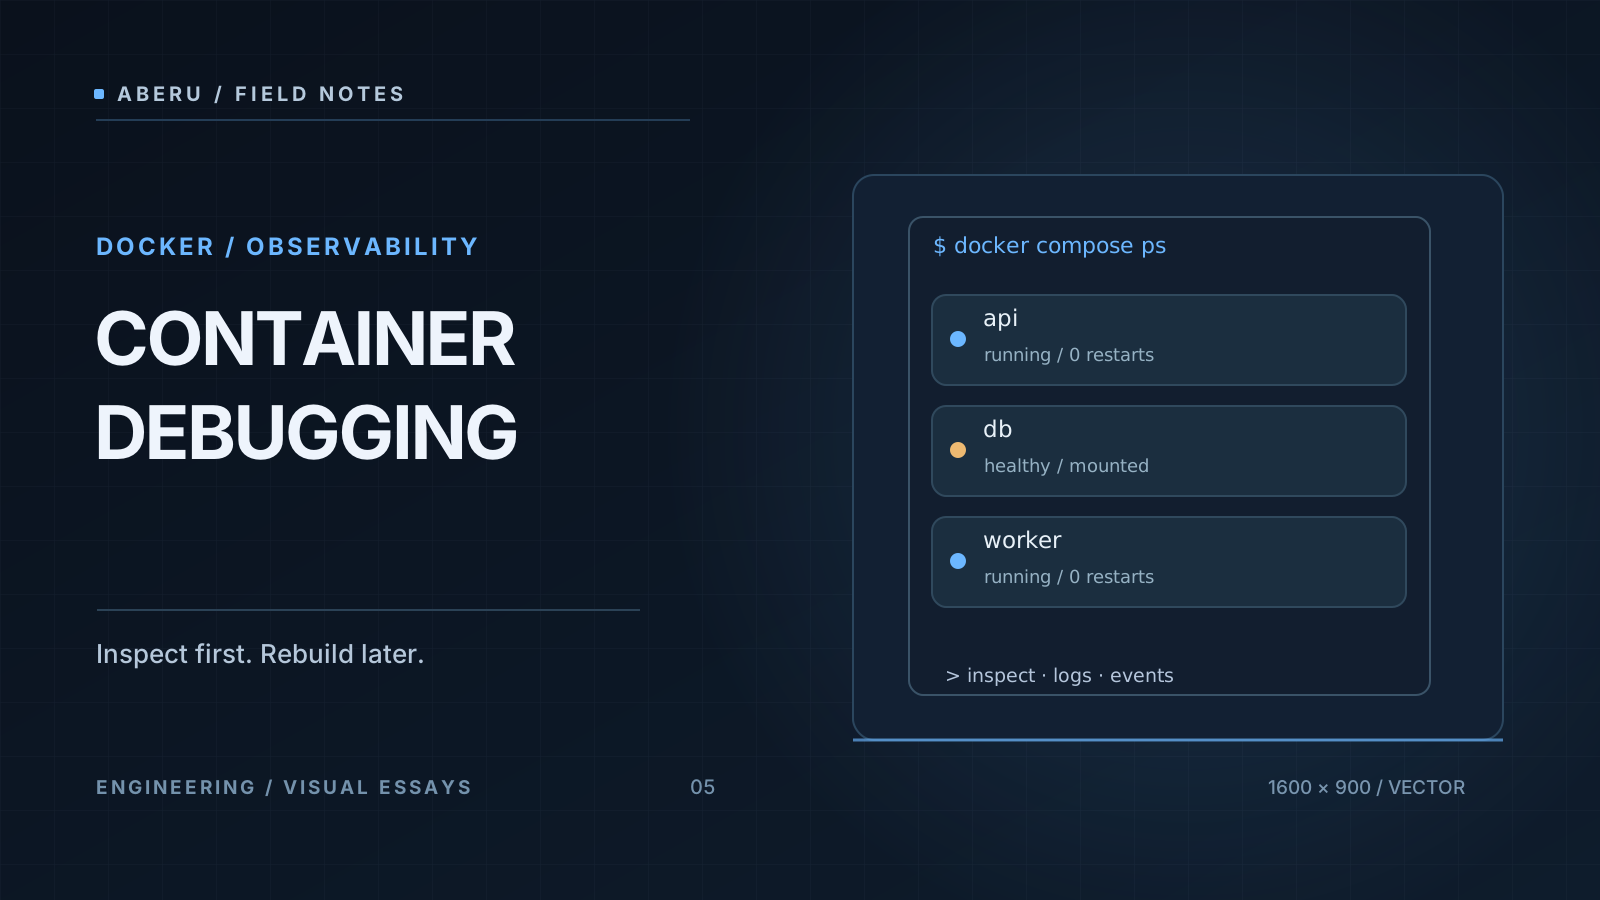
First passing: five read-only comments
For a Composer project called, for example, tienda, I would start by identifying the services and their status. The names are illustrative and the existence of this project isn’t assumed.
# Ejecutar desde el directorio que contiene compose.yaml.
docker compose ps -a
# Una ventana de logs limitada evita ocultar el inicio del fallo.
docker compose logs --timestamps --tail=150 api
# Ver configuración interpolada: puede revelar secretos. No compartir la salida.
docker compose config --services
# Inspección del contenedor por nombre/ID obtenido de `ps`.
docker inspect --format '{{json .State}}' CONTAINER_ID
# Eventos recientes, con intervalo finito y timestamps.
docker events --since 10m --until 0s --filter type=container
The output of docker inspect includes Running, Restarting, ExitCode, OOMKilled, Error, start / end times and, if available, the ExitCode object. The comando oficial inspect allows you to inspect objects and format them. It’s no proof that the application complies with your business contract. docker compose ps -a reveals finished containers that would disappear from a single-run vision.
docker compose config offers an effective file representation but can display sensitive interpolated values of variables. To review only names, --services minimizes this exposure and if a concrete value is investigated, do so in an authorized environment and write the logs. Logs can also contain tokens, addresses and personal data. Your collection is an action of reading from Docker’s API, not permission to spread them.
A reasonable order of interpretation is symptom → tirestamp → process → resource → dependence, before performing a retreat. For instance, that the API report connection refused to a base may indicate that the destination does not listen, that it uses an incorrect hostel or that both services are in different networks. Reinitiating the API does not discriminate with these hypotheses.
A continuous case: API, PostgreSQL and proxy
Consider an HTTP API that connects to PostgreSQL in a network defined by Compose. The following example is a * conceptual topology *; it isn’t a production file because they miss images set by digest, secrets, health checks, boundaries and backup politics.
services:
  api:
    image: registry.example.invalid/tienda-api:demostracion
    environment:
      DATABASE_HOST: db
      DATABASE_PORT: "5432"
    ports:
      - "127.0.0.1:8080:8080"
    depends_on:
      - db
  db:
    image: postgres:18
    volumes:
      - datos_pg:/var/lib/postgresql
volumes:
  datos_pg:
The registry.example.invalid image is deliberately non-existent: it serves to explain configuration, not to literally raise the project. Also, depends_on in its short form lays down a start order, does not prove that PostgreSQL is ready to accept transactions. That contract should be defined with an appropriate health check, migration and controlled reattempts on the implementation side. The referencia de Compose differentiates service_started from service_healthy.
Step 1: What are you listening to and where?
The name db can be solved at the address of the PostgreSQL container as DNS built into user-defined networks are used. The port 5432 is internal and does not have to be published in the host for use by api. Instead, 127.0.0.1:8080:8080 publishes the API only at the loopback interface of the host under compatible network conditions. It does not turn service into public and does not mean that a remote proxy can achieve it.
# Puertos publicados en el host: no incluyen necesariamente puertos internos.
docker compose port api 8080
# Redes y direccionamiento desde la perspectiva del runtime.
docker inspect --format '{{json .NetworkSettings.Networks}}' CONTAINER_ID
# Configuración de los puertos declarados y sus bindings.
docker inspect --format '{{json .HostConfig.PortBindings}}' CONTAINER_ID
There are at least four independent tests: (1) the process hears at 0.0.0.0:8080 or at the right interface within its container, (2) api can solve and contact db:5432, (3) the host can connect to the published port, (4) an outside client can cross DNS, firewall and, if appropriate, reverse proxy and TLS. That one works doesn’t prove the other. See Docker networking and port publishing.
To observe listeners and conduct network tests without changing the image, we can use tools already present onto them or an authorized diagnostic container on the same network, documenting their configuration and permissions. docker exec isn’t the first step: a dystroless image may not include shell, curl and ss. Also, performing processes temporarily disrupts the environment and may require additional privileges. No new software should be entered into the production container just to conduct a check.
Step 2: Do health checks measure what we believe?
A container may be healthy because it responded to /health while SQL consultations failed by credentials or migration. It can also be unhealthy because his check invokes curl in an image without curl. Separate * survival *, * readiness * and an outside test prevents circular diagnosis. Check with inspect both the effective definition and the history of Health.Log if available and compare with a demand from the same network border as the consumer fails.
RestartCount or Restarting high are symptoms: they have to be correlated with export code, login, events and display changes. A restart policy reduces inavailability for passing faults and can cover up a persistent error if you only look at docker ps.
Resources: CPU, memory, disc and boundaries
docker stats offers a consumer window and docker inspect reveals established boundaries. The memory observed by the tool, pachet accounting, cgroup boundaries and actual memory of the host should be distinguished. A pic of CPU can be useful processing and a high performance drop without CPU can also indicate backstop, network or database locks.
docker stats --no-stream
docker inspect --format '{{json .HostConfig.Memory}}' CONTAINER_ID
docker system df
# En un host Linux con permisos: contrastar además con las métricas del sistema.
docker system df check with disc use and it’s not docker system prune. Do not run automatic cleanliness as an initial response: they could remove images necessary for rollback or clear resources that you did not understand. If OOMKilled=true appears, the memory lack hypothesis gain strength but we have to correlate the cgroup limit, host pressure and workload. The métricas de Docker explain this model.
Persistence: A directory isn’t necessarily a volume
An application can write into /app/uploads inside the container cape and lose those files after re-creating them. Another can mount a volume onto a path that had been contained and “hidden.” A database can preserve local volume and still have no recoverable backup if the host is lost.
Before any volume change:
docker inspect --format '{{json .Mounts}}' CONTAINER_ID
docker volume ls
# Inspeccionar un volumen concreto cuyo nombre ya fue confirmado.
docker volume inspect NOMBRE_DEL_VOLUMEN
Three questions decide the recovery strategy: what process do you write?, what path of the container? * and * What physical object does that path support?. To register the Source, Destination, type of mount and reading / writing permits prevents confusing a bind mount with an administered volume. The volumes do not replace consistent copies of data, restoration tests and coordinated snapshots.
If a problem began after changing an image, the code rollback does not guarantee the reversibility of a database migration. A proven backup and a compatible interversion contract are still necessary. That limit also develops at Coolify: responsabilidades de operación.
What does Lazydicker add and what doesn’t
Lazydocker brings together with a terminal interface list of containers, services and images, login views and consumer charts. It’s useful when we co-relate several services and we need to navigate with them quickly. It runs as Docker’s client, but as a substitute for daemon, host and compose, authority and access depend on socket and used credentials.
| Use | Lazydicker | CLI / other instruments |
|---|---|---|
| Recognize services and explore login | Excellent for interactive triage | docker compose ps, logs, events are playable in notes |
| Inspect precise configuration | General view as per version | docker inspect and docker compose config allow capture of exact data |
| Search for an OOM or I / O cause | Visual Track | Cgroup / host metrics, logs, traces and storage require other signals |
| Executing actions | There are controls that change status | Require authorisation and recovery plan in both IU and CLI |
The configuración oficial and its keybindings should be revised by version. Some indicators inside a container can be incomplete while running Lazydicker itself as a container and the tool document login and CPU limitations in that modality. No sign in this article indicates that an interface will be faster than another.
The best practice is to use the TUI to locate a symptom and write down the exact evidence in verifiable commands and identifiers: tirestamp, container, digest image, network and volume configuration, daemon version, malfunction type. A single screen capture is difficult to play or audition.
Security during diagnosis
To belong to the docker group can issue root-equivalent permits to the host. There’s no automatic separation between “I just want to see logs” and “I have permission to manage any container”: it depends on the access architecture. Docker documenta this involvement and offers Rootless Mode as an alternative under specific requirements with cgroup and network differences to be evaluated.
No need for --privileged, mount sensitive host directories or deactivate seccomp / AppArmor / SELinux to observe a regular application defect. If a purifying tool so requests, we should explain what information lacks and what explicit authorization exists before applying privileges. Also complete logs with secrets should be sent to chat, public issues or third party services.
The principle also applies to commands of apparent comfort: down -v, prune, rm and other destructive operations are not part of the first course. Do not mix collection of evidence with remediation prevents them from simply deleting information necessary to explain the incident.
Playbook: from incident report to action
- Determining impact. Service, first known hour, users affected and recent changes and do not assume that the failure originates at last deploy.
- Filling evidence. **
ps -a, pitted login,inspect, events and effective configuration with sensitive data drafted. - To form hypotheses by border. Process, dependencies, network, proxy, resources, disc and mount. To select an outcome check that can challenge each hypothesis.
- Test without altering. To prefer observation and reading only endpoints. If something needs to be modified, first defining impact, reversion and authorisation.
- To correct the cause. To change one variable or component at a time with version and configuration registration and avoid “re-starting” as a test.
- Check from outside. Prove an unsuccessful application as well as an internal status and health check. To confirm integrity and persistence as appropriate.
- Documentate prevention. Missing sign, alert, test or runbook; including what could not be observed.
Proposed laboratories - with no measured results
| Case | Controlled variable | Discrimination sign | State |
|---|---|---|---|
| Process ends at start | Invalid command / variable in fictitious service | Exit code + login + events | Proposed, Not implemented |
| List linked to internal loopback | Application Bind | Internal connection vs. publication | Proposed, Not implemented |
| DNS between networks | Network attack | Name and route resolution | Proposed, Not implemented |
| Readiness before you start DB | Availability time | Health + first actual access | Proposed, Not implemented |
| Memory pressure | Laboratory cgroup boundary | OOMKilled and metric | Proposed, Not implemented |
| Writing without volume | Mount declared absent | Status before / after recreation | Proposed, Not implemented |
| Storage without space | Laboratory share / disc | Write and metric error | Proposed, Not implemented |
| Divergent configuration | Effective env and image | Expected value vs. observed | Proposed, Not implemented |
Each protocol needs a recoverable environment, versions and date, written logs, success / failure of hypotheses and explicit result. The guide can be applied with Docker CLI or Lazydicker in an isolated project, never leading to third party service or production.
Closure: first evidence, after controls
The production of containers ceases to be a collection of “saving commands” as a system diagnosis. Docker offers status, networks, mount, events and metrics and Lazydocker reduces the friction of browsing these signage but does not add magic information or replace an evaluation of host and application.
The following training phase is to convert a diagnosis session into a repeatable experiment with the same care as applying to entornos declarativos: registered inputs, sharp steps and conclusions supported by observations.
Primary references
- Docker: overview y arquitectura.
- Docker: inspect, logs, events and port publishing.
- Docker: volúmenes, métricas and Rootless Mode.
- Lazydocker: repositorio, configuración and keybindings.


